Intro
In geometric analysis, a horizontal line runs parallel to the x-axis. In other words, on a perfectly horizontal line all values on it will have the same value of y. This analysis can be useful in determining many values in business, trading, and other areas of life. In this article, we will discuss why the horizontal line is so important in business and provide some tips on how to use the horizontal line to your advantage.
Understanding a Horizontal Line
In trading, the horizontal line is used to denote support and resistance. Support is the level at which buyers are thought to be strong enough to prevent prices from falling further. Resistance, on the other hand, is the level at which sellers are thought to be sufficiently motivated to prevent prices from rising further.
The horizontal line is a useful tool for identifying potential entry and exit points in a market. It can also be used to set trailing stop losses and target profits. However, it is important to remember that the horizontal line is not a precise indicator, and prices can often move outside of the expected range. As such, it should be used in conjunction with other technical indicators to form a comprehensive trading strategy.
Fundamental Horizontal Analysis
Fundamental horizontal analysis is a method of financial analysis that is used to compare ratios over time, across industries, or between companies. This type of analysis can be used to identify trends, assess risk, and make investment decisions.
To perform fundamental horizontal analysis, financial statements must first be converted into common-size statements. This involves expressing all items on the statement as a percentage of a common base figure, such as total assets or total revenue. Once the financial statements have been converted into a common-size format, ratios can be calculated and compared over time or across different companies. Fundamental horizontal analysis is an important tool for investors and analysts who want to gain a deeper understanding of a company’s financial health.
A Horizontal Line as it Relates to Supply and Demand Curves
In Economics, the concept of supply and demand is represented by two curves on a graph, with the horizontal line intersecting them indicating the equilibrium point. The demand curve slopes downward from left to right, showing that as the price of a good or service increases, the quantity demanded decreases. The supply curve, on the other hand, slopes upward from left to right, indicating that as the price of a good or service increases, the quantity supplied also increases. The point where the two curves intersect is known as the equilibrium point, where the quantity demanded is equal to the quantity supplied. At this point, neither buyers nor sellers have an incentive to change their behavior, and the market is in balance.

The Difference Between a Horizontal Line and a Trendline
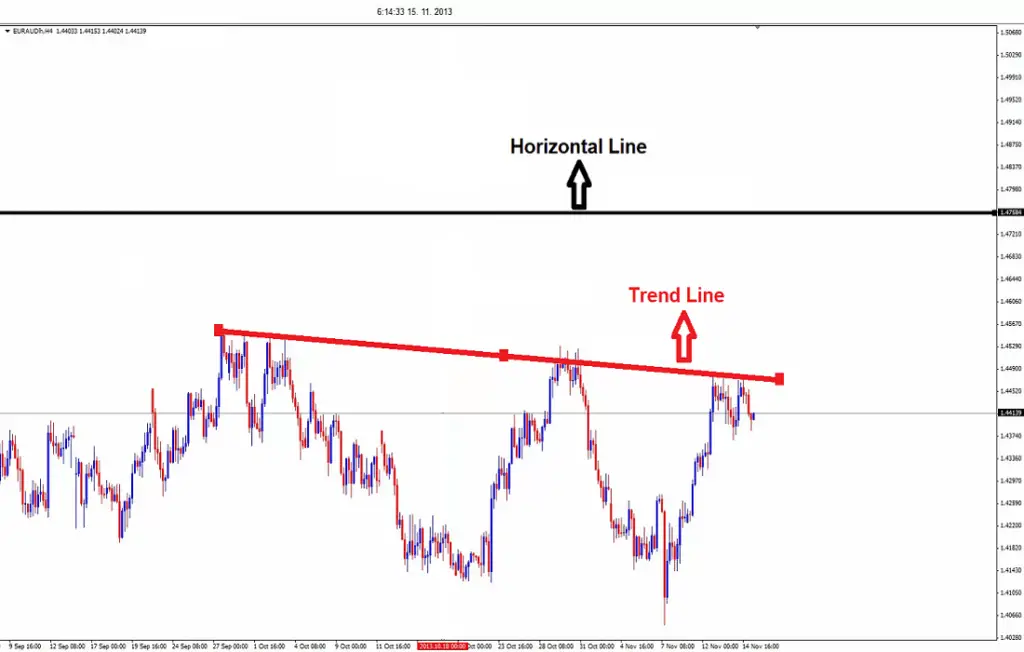
In technical analysis, a trendline is a bounding line for the price of a security. There are two types of trendlines that analysts use when studying charts: horizontal and slanted. A horizontal trendline connects two or more lows on a price chart. This line represents support because the market has generally stabilized at this price level and buyers have come in to prevent the price from falling further. A slanted trendline, on the other hand, is used to connect highs or lows and shows the general direction that the market is moving. This line can be either upward-sloping (bullish) or downward-sloping (bearish). Trendlines are one of the most basic tools in technical analysis and can be used to make predictions about future price movements.
Limitations of Using a Horizontal Line in Technical Analysis
When used correctly, technical analysis can be a valuable tool for predicting future price movements in the stock market. One of the most commonly used techniques is known as support and resistance analysis, which involves identifying key levels where the price is likely to reverse course. A horizontal line is often drawn on a chart to mark these levels, but there are a few limitations to this approach.
First of all, horizontal lines are only useful if the market is trading in a relatively tight range. If the price is trending up or down strongly, then the levels of support and resistance will be constantly shifting.
Secondly, horizontal lines can give false signals if the market is very volatile. In such conditions, the price may briefly break through a support or resistance level before quickly reversing course. As a result, technical analysts need to be aware of these limitations when using horizontal lines in their analysis.
